Timeframe and expiry: two different time fields
Why the candle period on a chart and the duration of a trade are worth reading separately.
SignalAI Editorial Team1 min read
In this article
You can see the same numbers next to the chart and on the signal card. To avoid mixing them up, start with the name of each time field.
What a timeframe is
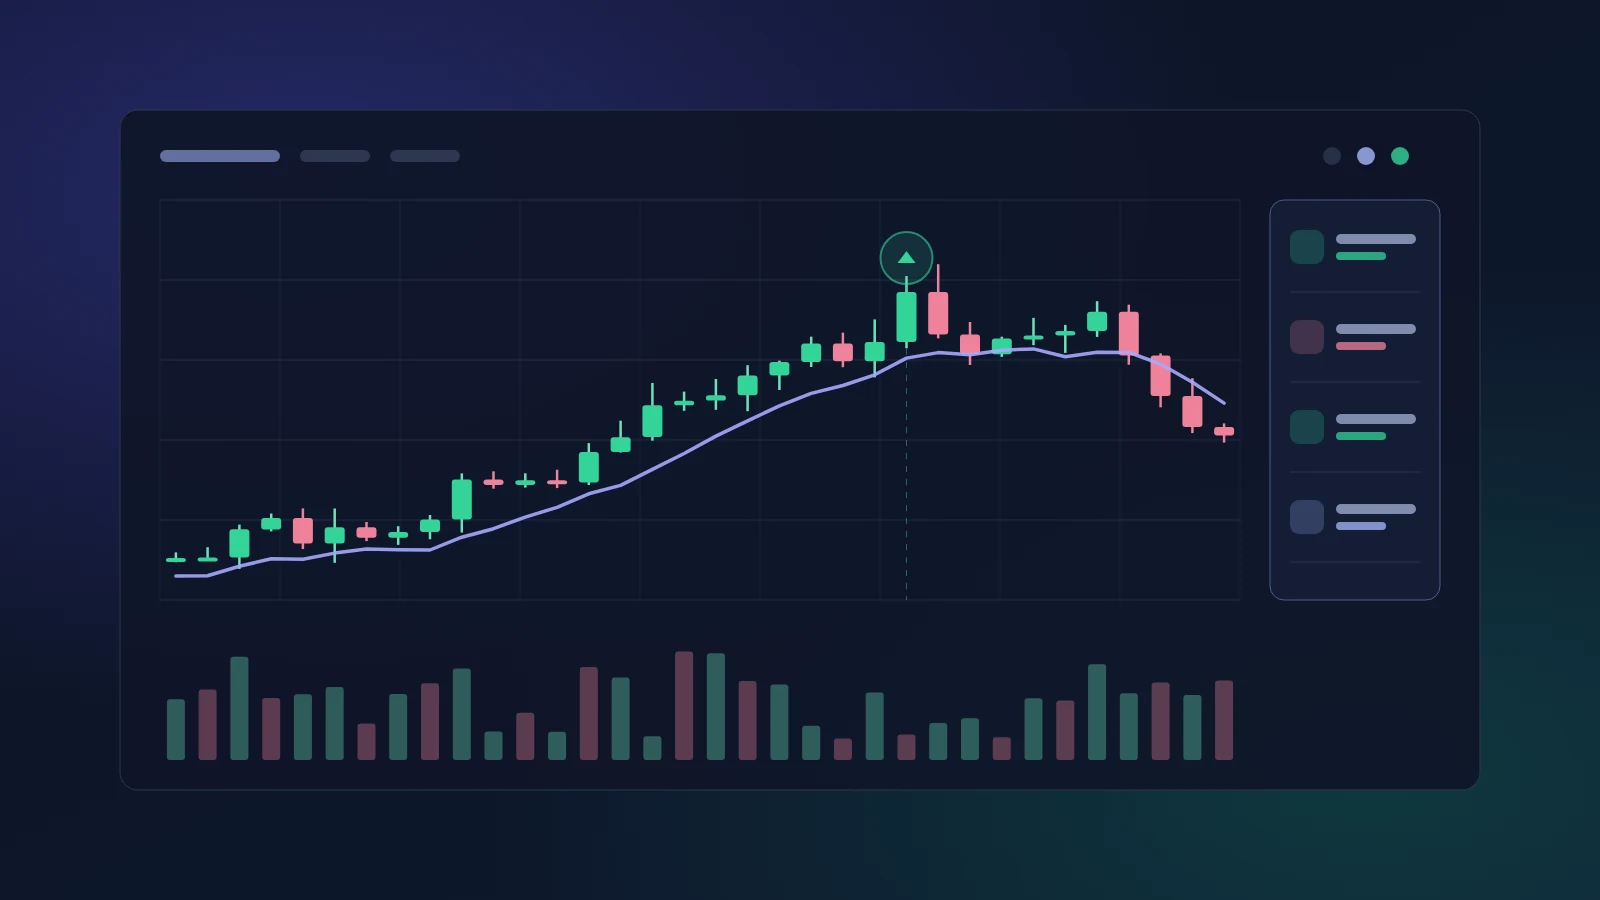
The timeframe sets the period that one candle on the chart represents. In the M5 notation, one candle corresponds to a five-minute interval.
What expiry means
Expiry refers to the end of a trade. On a card it can be shown as a duration or as a specific moment. The field label tells you how to read the value.
The same number, different fields
A 5 min label on the chart and on the card can look the same. The first belongs to how the data is displayed, the second to the trade's parameters. Go by the label, not just the number.