Candlestick charts: what a single candle shows
From open to close. A visual guide to how a candle is built and how the chart is labelled.
In this article
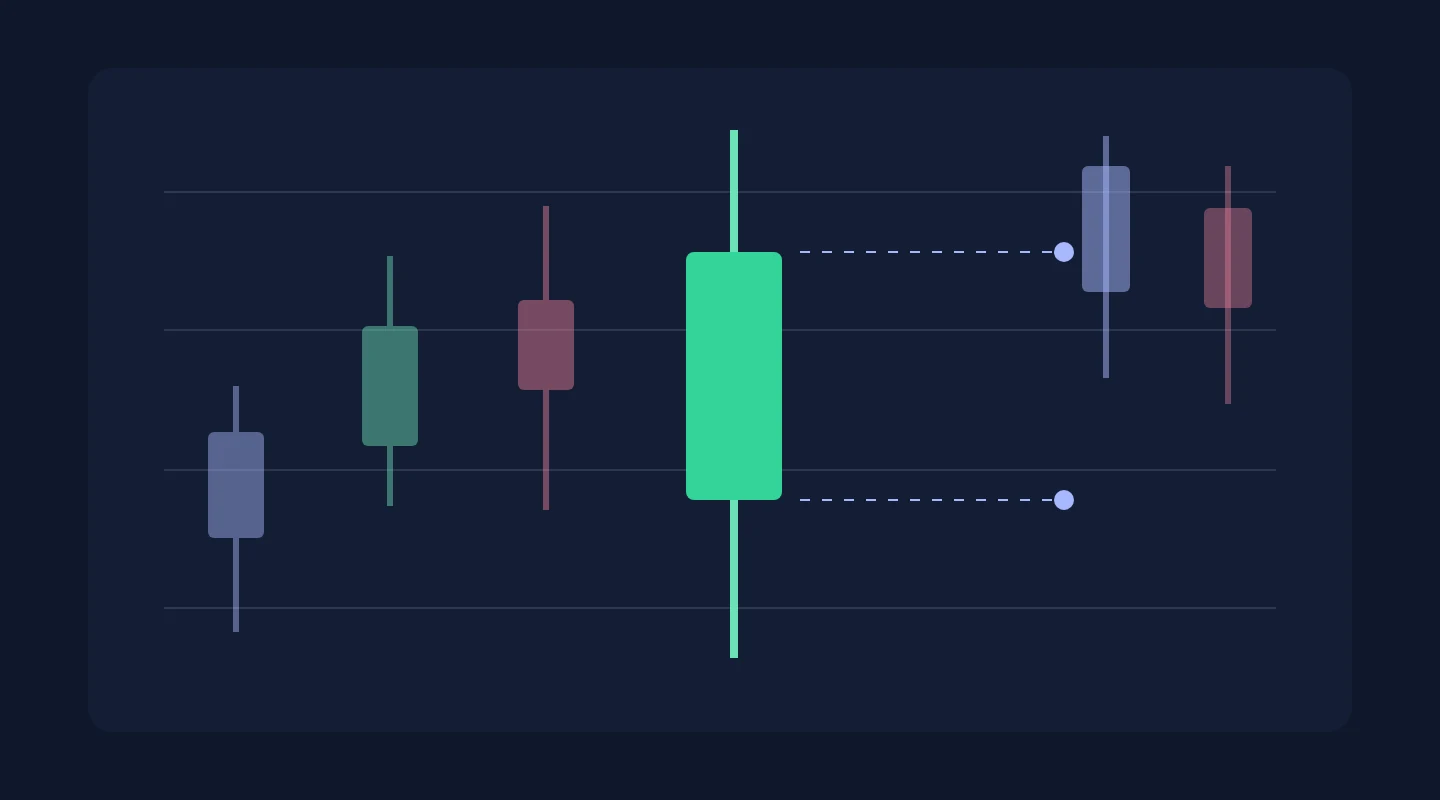
A candlestick chart compresses a period's data into a single shape. Let's take its parts apart on a diagram where every mark has its own label.
The body and shadows of a candle
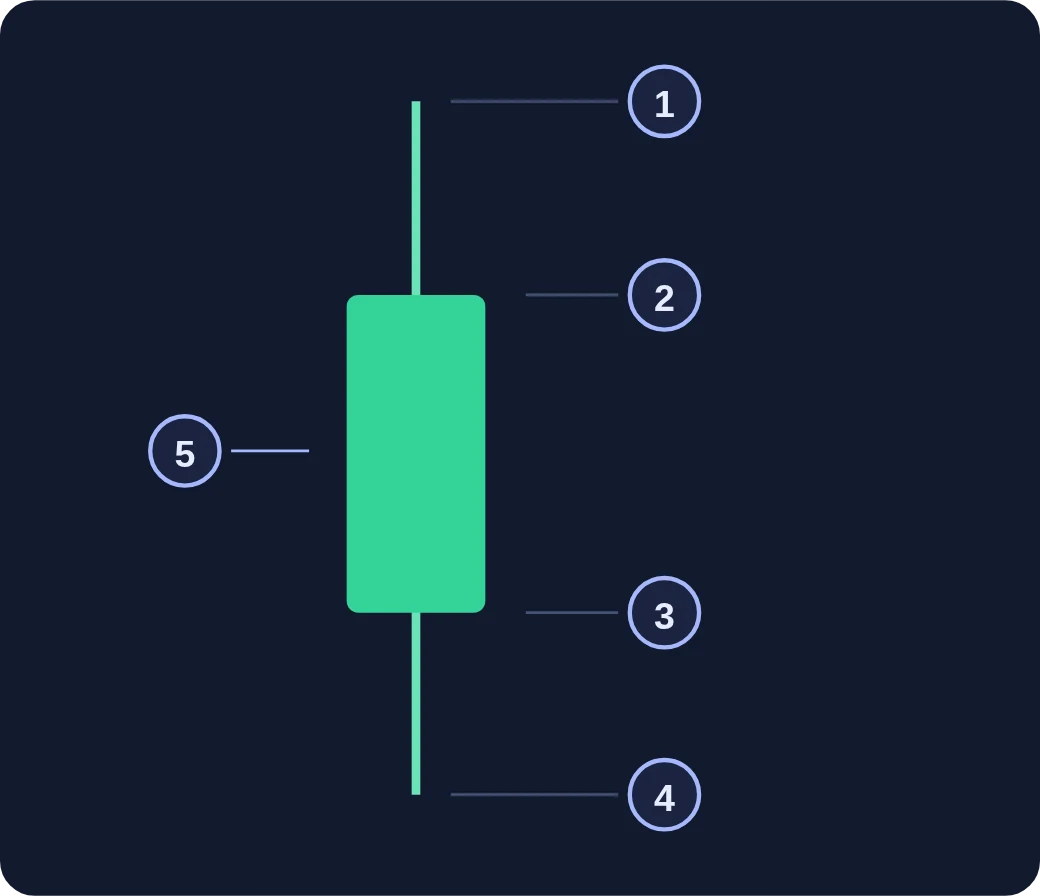
A candle shows how the price moved over the selected period. Its body connects the opening and closing prices, and the thin lines, called shadows, mark the high and low of that period.
Open and close
In the diagram below, the close is higher than the open. Colour helps you tell the direction of the change, but exact values have to be read from the chart's scale and labels.
The period matters
One candle corresponds to one interval of the selected timeframe. After you change the timeframe, the same market events are grouped into different candles.
Read the chart first
Check the asset name, the candle period and the price scale. The shape of a single candle describes data that is already on the chart and does not by itself guarantee the next price move.