Money management for signal trading: stake size, daily limits and drawdown
Why a 60% win rate can still lose money, how to size a stake so a losing run stays affordable, and the limits to set before the first trade.
In this article
A trader who wins 60 trades out of 100 sounds like a trader who makes money. Not necessarily. If a winning trade pays 65% of the stake and a losing one costs all of it, those 100 trades of $10 end $10 down: 60 wins bring in $390 and 40 losses take out $400. Accuracy tells you how often you are right. The payout tells you what being right is worth, and the stake decides how far each answer moves your balance. This guide works through all three with numbers you can check, and ends with the plan we suggest writing down before the first trade of the day.
Break-even: the win rate your payout demands
Every binary option trade has two outcomes. A win returns the stake plus the payout, a percentage the broker sets for each asset and expiry. A loss takes the whole stake. So the question is not whether you win more often than you lose, but whether your wins pay for your losses.
The win rate at which they cancel exactly is the break-even rate, and it depends on the payout alone:
Break-even win rate = 1 ÷ (1 + payout)
At an 80% payout that is 1 ÷ 1.8 = 55.6%. Below it you lose money over many trades, however good individual days feel.
The formula is one line of arithmetic. With a win rate w and a payout p, each dollar staked brings back w × p on average and loses (1 − w). The two are equal when w = 1 ÷ (1 + p). Nothing else enters the calculation: not the asset, not the expiry and not the size of the stake.
It follows that the payout is part of your strategy, not a detail of the broker’s interface. A signal that is right 58% of the time is a profitable signal at an 80% payout and a losing one at 70%. Before you judge a set of signals, or your own trading, find the payout you actually received and compare your win rate with the break-even rate for it.
The payout is not a constant either. It can differ between assets and expiries on the same platform, and it can change during the day. That is why the session plan at the end of this guide checks it before the first trade instead of once a month.
What the examples assume
The figures in this guide use round win rates, 55%, 60% and 65%, chosen to show how the arithmetic behaves. They are not the results of our signals, which the home page reports separately, and nobody should plan with a win rate they have not measured on their own trades.
- Payout in the example
- 80%
- Break-even win rate
- 55.6%
- 100 trades of $10 at 60%
- +$80
- The same trades at 55%
- −$10
The break-even table, payout by payout
The table runs from a 65% payout to 92%, one point at a time. For each payout it gives the break-even win rate and the net result of 100 trades of $10 at three win rates, with exactly that share of the trades won. A plus is a profit, a minus a loss. The 80% row is the example above.
Two things stand out. Below a 67% payout, even 60% accuracy loses money. And each extra point of payout lowers the break-even rate by about a third of a point: a broker that pays 85% instead of 80% gives you 1.5 points of accuracy for free, which is more than most changes to a strategy can promise.
Payout | Break-even win rate | Net at 55% | Net at 60% | Net at 65% |
|---|---|---|---|---|
65% | 60.6% | −$92 | −$10 | +$72 |
66% | 60.2% | −$87 | −$4 | +$79 |
67% | 59.9% | −$82 | +$2 | +$86 |
68% | 59.5% | −$76 | +$8 | +$92 |
69% | 59.2% | −$70 | +$14 | +$98 |
70% | 58.8% | −$65 | +$20 | +$105 |
71% | 58.5% | −$60 | +$26 | +$112 |
72% | 58.1% | −$54 | +$32 | +$118 |
73% | 57.8% | −$48 | +$38 | +$124 |
74% | 57.5% | −$43 | +$44 | +$131 |
75% | 57.1% | −$38 | +$50 | +$138 |
76% | 56.8% | −$32 | +$56 | +$144 |
77% | 56.5% | −$26 | +$62 | +$150 |
78% | 56.2% | −$21 | +$68 | +$157 |
79% | 55.9% | −$16 | +$74 | +$164 |
80% | 55.6% | −$10 | +$80 | +$170 |
81% | 55.2% | −$4 | +$86 | +$176 |
82% | 54.9% | +$1 | +$92 | +$183 |
83% | 54.6% | +$6 | +$98 | +$190 |
84% | 54.3% | +$12 | +$104 | +$196 |
85% | 54.1% | +$18 | +$110 | +$202 |
86% | 53.8% | +$23 | +$116 | +$209 |
87% | 53.5% | +$28 | +$122 | +$216 |
88% | 53.2% | +$34 | +$128 | +$222 |
89% | 52.9% | +$40 | +$134 | +$228 |
90% | 52.6% | +$45 | +$140 | +$235 |
91% | 52.4% | +$50 | +$146 | +$242 |
92% | 52.1% | +$56 | +$152 | +$248 |
Stake size: a fixed amount or a fixed share of the balance
Break-even tells you whether a series of trades can make money. The stake decides whether you are still trading when it does. There are two common ways to size a stake, and the difference only shows after a bad run.
A fixed amount
You stake the same sum on every trade, say $10 from a $1,000 balance. It is simple, and easy to check in a journal. The weakness is that the risk grows as the balance shrinks: after losing $300, the same $10 is 1.43% of what is left instead of 1%, just when caution matters most.
A fixed percentage
You stake the same share of the current balance, say 1%. After a loss the next stake is a little smaller, after a win a little larger. A losing run costs slightly less with every trade, and in theory the balance never reaches zero, although a broker’s minimum stake sets a practical floor.
A useful property follows. With a fixed percentage, the order of wins and losses does not change where the balance ends up, only the path it takes. 120 wins and 80 losses at a 1% stake and an 80% payout take $1,000 to $1,164.34 in any order. The order decides how deep the dips are on the way, which the drawdown section measures.
Choose a fixed amount if you trade a few times a week and review the balance every weekend.
Choose a fixed percentage if you trade daily, or if the balance is one you cannot easily top up.
Whichever you choose, write it down and keep it for at least 100 trades, so the journal measures the signals rather than your changes of mind.
When the broker’s minimum gets in the way
With a small balance, 1% may be less than the smallest stake the broker accepts. On a $300 balance 1% is $3; if the minimum is $5, every trade already risks 1.7% of the balance. In that case trade less often rather than bigger: take only the signals on the assets and expiries where your journal shows the best record, and stay at the minimum until the balance has grown to the point where 1% clears it.
Martingale: what doubling promises
Martingale means doubling the stake after every loss, so that the first win recovers everything lost before it and adds a small profit.
One win closes the losing run
On a bet that pays even money, doubling after each loss recovers every earlier loss with the next win.
Most sessions look profitable
Short losing runs are common and long ones rare, so for a while almost every session ends slightly up.
Martingale: what it actually costs
Binary options pay less than even money, and the stakes grow faster than any balance can follow.
An 80% payout stops recovering after two losses
After losing $10, $20 and $40, a win on $80 pays $64 against $70 already lost. The cycle ends $6 down even though it ended with a win.
The seventh stake does not fit
Starting from $10 on a $1,000 balance, six losses cost $630. The next stake would be $640, with only $370 left.
Why one losing streak ends a martingale
The trouble is not that a long losing run is likely on any given day. It is that you trade hundreds of times, and over hundreds of trades it becomes likely somewhere. Here is the doubling sequence from a $10 stake on a $1,000 balance, with the total lost if each stake fails:
$10: $10 lost in total.
$20: $30 lost.
$40: $70 lost.
$80: $150 lost.
$160: $310 lost.
$320: $630 lost.
$640: more than the $370 that is left, so the sequence cannot continue.
Warning: Six losses in a row are not rare. At a 60% win rate, 200 trades contain at least one run of six or more losses 38.7% of the time. Doubling from $10 on $1,000 turns that run into a $630 loss, and at an 80% payout the sequence had already stopped recovering its losses after the second one. Do not double the stake after a loss.
Drawdown: the same 200 trades at 1% and at 5%
Drawdown is the fall from the highest balance so far to the lowest point that follows it, as a percentage of that high. It is the number that decides whether a way of trading is bearable, because you live through the fall before you see the recovery.
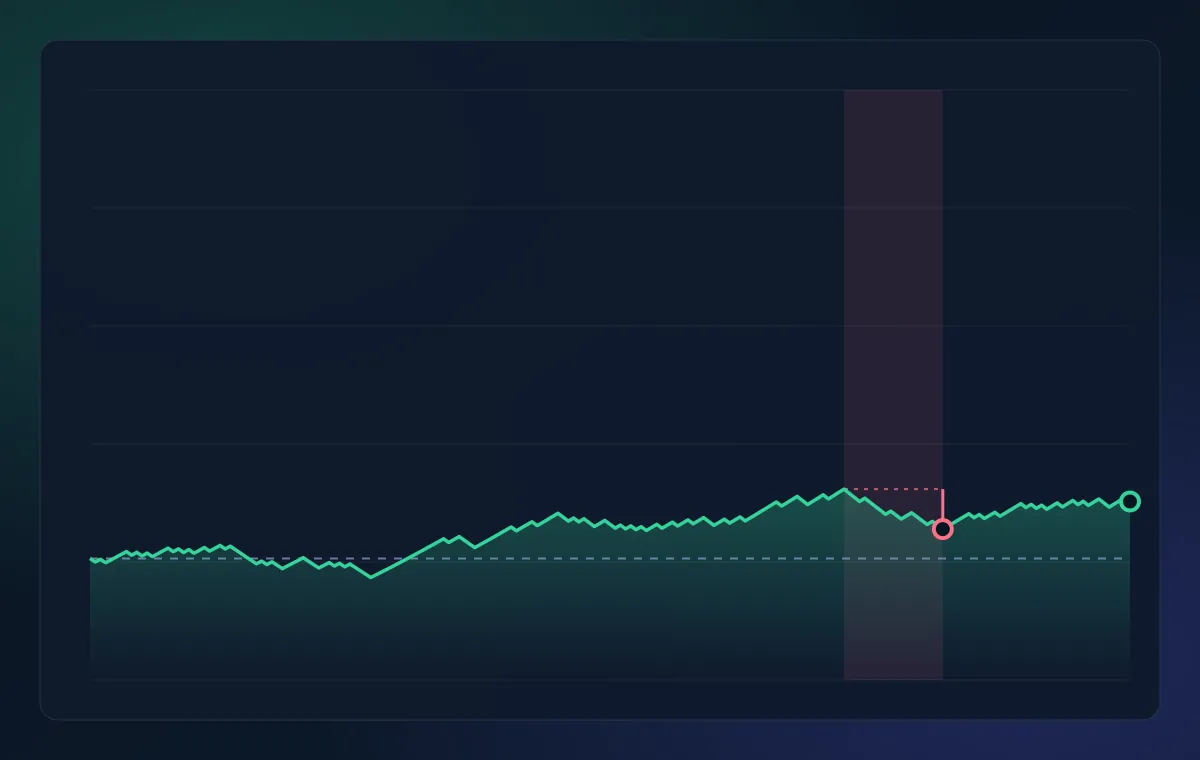
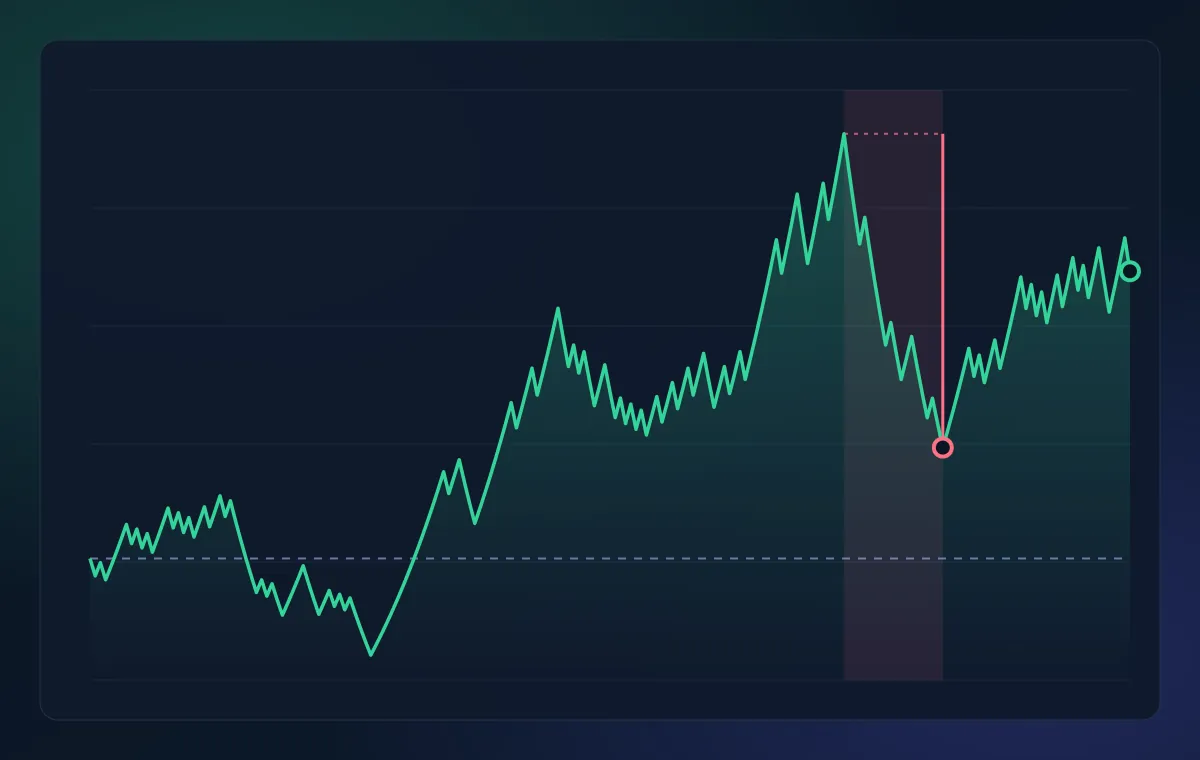
To show it, we took 200 illustrative trades with a 60% win rate and an 80% payout: exactly 120 wins and 80 losses in a random order. We did not pick the order to look good or bad. Its longest losing run, five trades, is the most likely longest run for 200 trades at this win rate. We then played the same order twice from $1,000, staking 1% of the balance once and 5% the second time. Both charts use the same scale, and the dashed line marks the starting $1,000.
- Deepest fall at a 1% stake
- 9.6%
- Deepest fall at a 5% stake
- 40.7%
- Longest losing run in the sample
- 5
- Lowest balance at 5%, from $1,000
- $722
What the two curves teach
In this sample the 5% line ended higher, and that is not a reason to choose it. At an exact 60% win rate and an 80% payout, larger stakes do grow faster on average, up to a point. But look at what the 5% line asked in return. On trade 54 it was down to $721.83, more than a quarter below the start. Later it gave back $904 in 19 trades. Few people keep following a plan through that, and the ones who abandon it usually do so at the bottom.
Deep falls also cost more than they look. A fall of 9.6% needs a gain of 10.6% to get back to the high; a fall of 40.7% needs 68.6%. The deeper the hole, the longer you trade below your best balance, and the more tempting it becomes to raise the stake to climb out faster.
More important, the 60% was given. In real trading you estimate your win rate from your journal, and the estimate can be several points off. Suppose the true rate is 56%, only just above the 55.6% break-even. Each $10 trade still has a small positive expectation of $0.08. Yet at a 5% stake the balance tends to shrink, by about 0.06% per trade, because a loss takes a bigger bite out of the balance than a win gives back. Over 200 trades that is typically $1,000 turning into about $886. At 1% the same trades leave the balance roughly where it started, at about $1,008.
That is the real case for small stakes: they keep you trading while you are still finding out how accurate you are. We suggest 1% to 2% of the balance per trade until your journal holds at least 200 trades on the same kind of signal.
Losing streaks: how often to expect them
A losing run feels like a sign that something has broken. Usually it is arithmetic. At a 60% win rate each trade has a 40% chance of losing, and over 200 trades long runs are close to certain to appear somewhere. These are the chances that 200 independent trades contain at least one run of each length:
5 losses in a row or more: 71.4%.
6 or more: 38.7%.
8 or more: 7.4%.
10 or more: 1.2%.
A run of five says little about the signals, since most samples of 200 trades contain one. Plan for it: at a 1% stake five losses cost just under 5% of the balance, which is why the session plan below stops after four.
When a long streak is a reason to stop
A run of ten is a different matter. At a true 60% win rate it turns up in about one sample of 200 trades in eighty, so it deserves a pause and a look at the journal. The market may have changed, the payout may have dropped, or trades may have been taken outside the plan.
The chances assume independent trades
Real trades are not coin tosses. A news release, a strongly trending market or plain fatigue can link one loss to the next, which makes long runs more likely than these figures, not less. Treat them as the least you should prepare for.
The session plan: decide before the first trade
The worst decisions about stake size are made just after a loss, when the next trade feels like a chance to get even. The remedy is to decide everything before the session starts and to write it where you will see it. These five steps take a few minutes.
Note the balance
Write down the balance you start with. Every limit for the day is a share of this number, not of yesterday’s high.
Set the stake
Take 1% of the balance, round it down to the broker’s step and keep it for the whole session, win or lose.
Set the daily loss limit
Four stakes, or 4% of the starting balance. When the day’s losses reach it, the session is over.
Check the payouts
Look up the payout for each asset and expiry you plan to trade. Skip any whose break-even rate is above your measured win rate.
Open the journal
Have it ready, so every trade is logged before the next one rather than pieced together in the evening.
The stop rules
Any one of these ends the session, even if the next signal looks good.
Four losses in a row
Stop, even if the day’s loss is still under the limit. Come back tomorrow with a fresh balance.
The daily limit is reached
Stop at four stakes down, even in the middle of a setup that looks promising.
You catch yourself raising the stake
A change to the stake during a session means the plan has stopped working for today.
The payout falls below break-even
If the broker lowers the payout, the trade no longer suits your win rate, however strong the signal.
What the rules did to the sample
We read the 200 trades as 20 sessions of ten signals and applied the plan: a 1% stake fixed at the start of each session, and a stop after four losses in a row or at four stakes down. Twelve sessions ended in profit, six ended down within the limit and two were stopped by a rule. 190 of the 200 signals were traded.
The rules did not improve the result. The sample finished at $1,114.83 with them and at $1,165.69 without them, because every skipped trade had the same 60% chance as the rest. That is to be expected: when every trade has identical odds, stopping early can only cost money.
The rules earn their place on the days that are not like the sample: a news release that makes the market jumpy, a payout that quietly drops, or a trader who is tired and angry after a loss. A sample of independent trades cannot show those days. Your journal eventually will, and the stop rules are what keep such a day to 4% of the balance.
Before the session: the checklist
Read it before the first trade. If one line is not true, the session starts later or not at all.
The starting balance is written down.
The stake is 1% of it, rounded down, and the same for every trade today.
The daily loss limit is written down in money.
Today’s payouts are above break-even for my measured win rate.
The journal is open.
I know when I will stop: four losses in a row, the limit, or the end of the time I planned.
The journal: where the numbers come from
Every figure in this guide comes from counting: wins, losses, stakes and payouts. Your own figures come from the same place, which is why the journal is part of money management rather than an extra. Without it you cannot know your win rate, and without the win rate the break-even table is guesswork.
Once a week, turn the journal into four numbers: trades taken, win rate, average payout and deepest fall. Compare the win rate with the break-even rate for that payout. If it sits within a couple of points of break-even, treat the week as unproven rather than good or bad, and leave the stake where it is.
The illustration below is a page from a journal kept with the plan above: the first 26 trades of the sample at a 1% stake. At column width its rows are too small to read, so open it at full size.
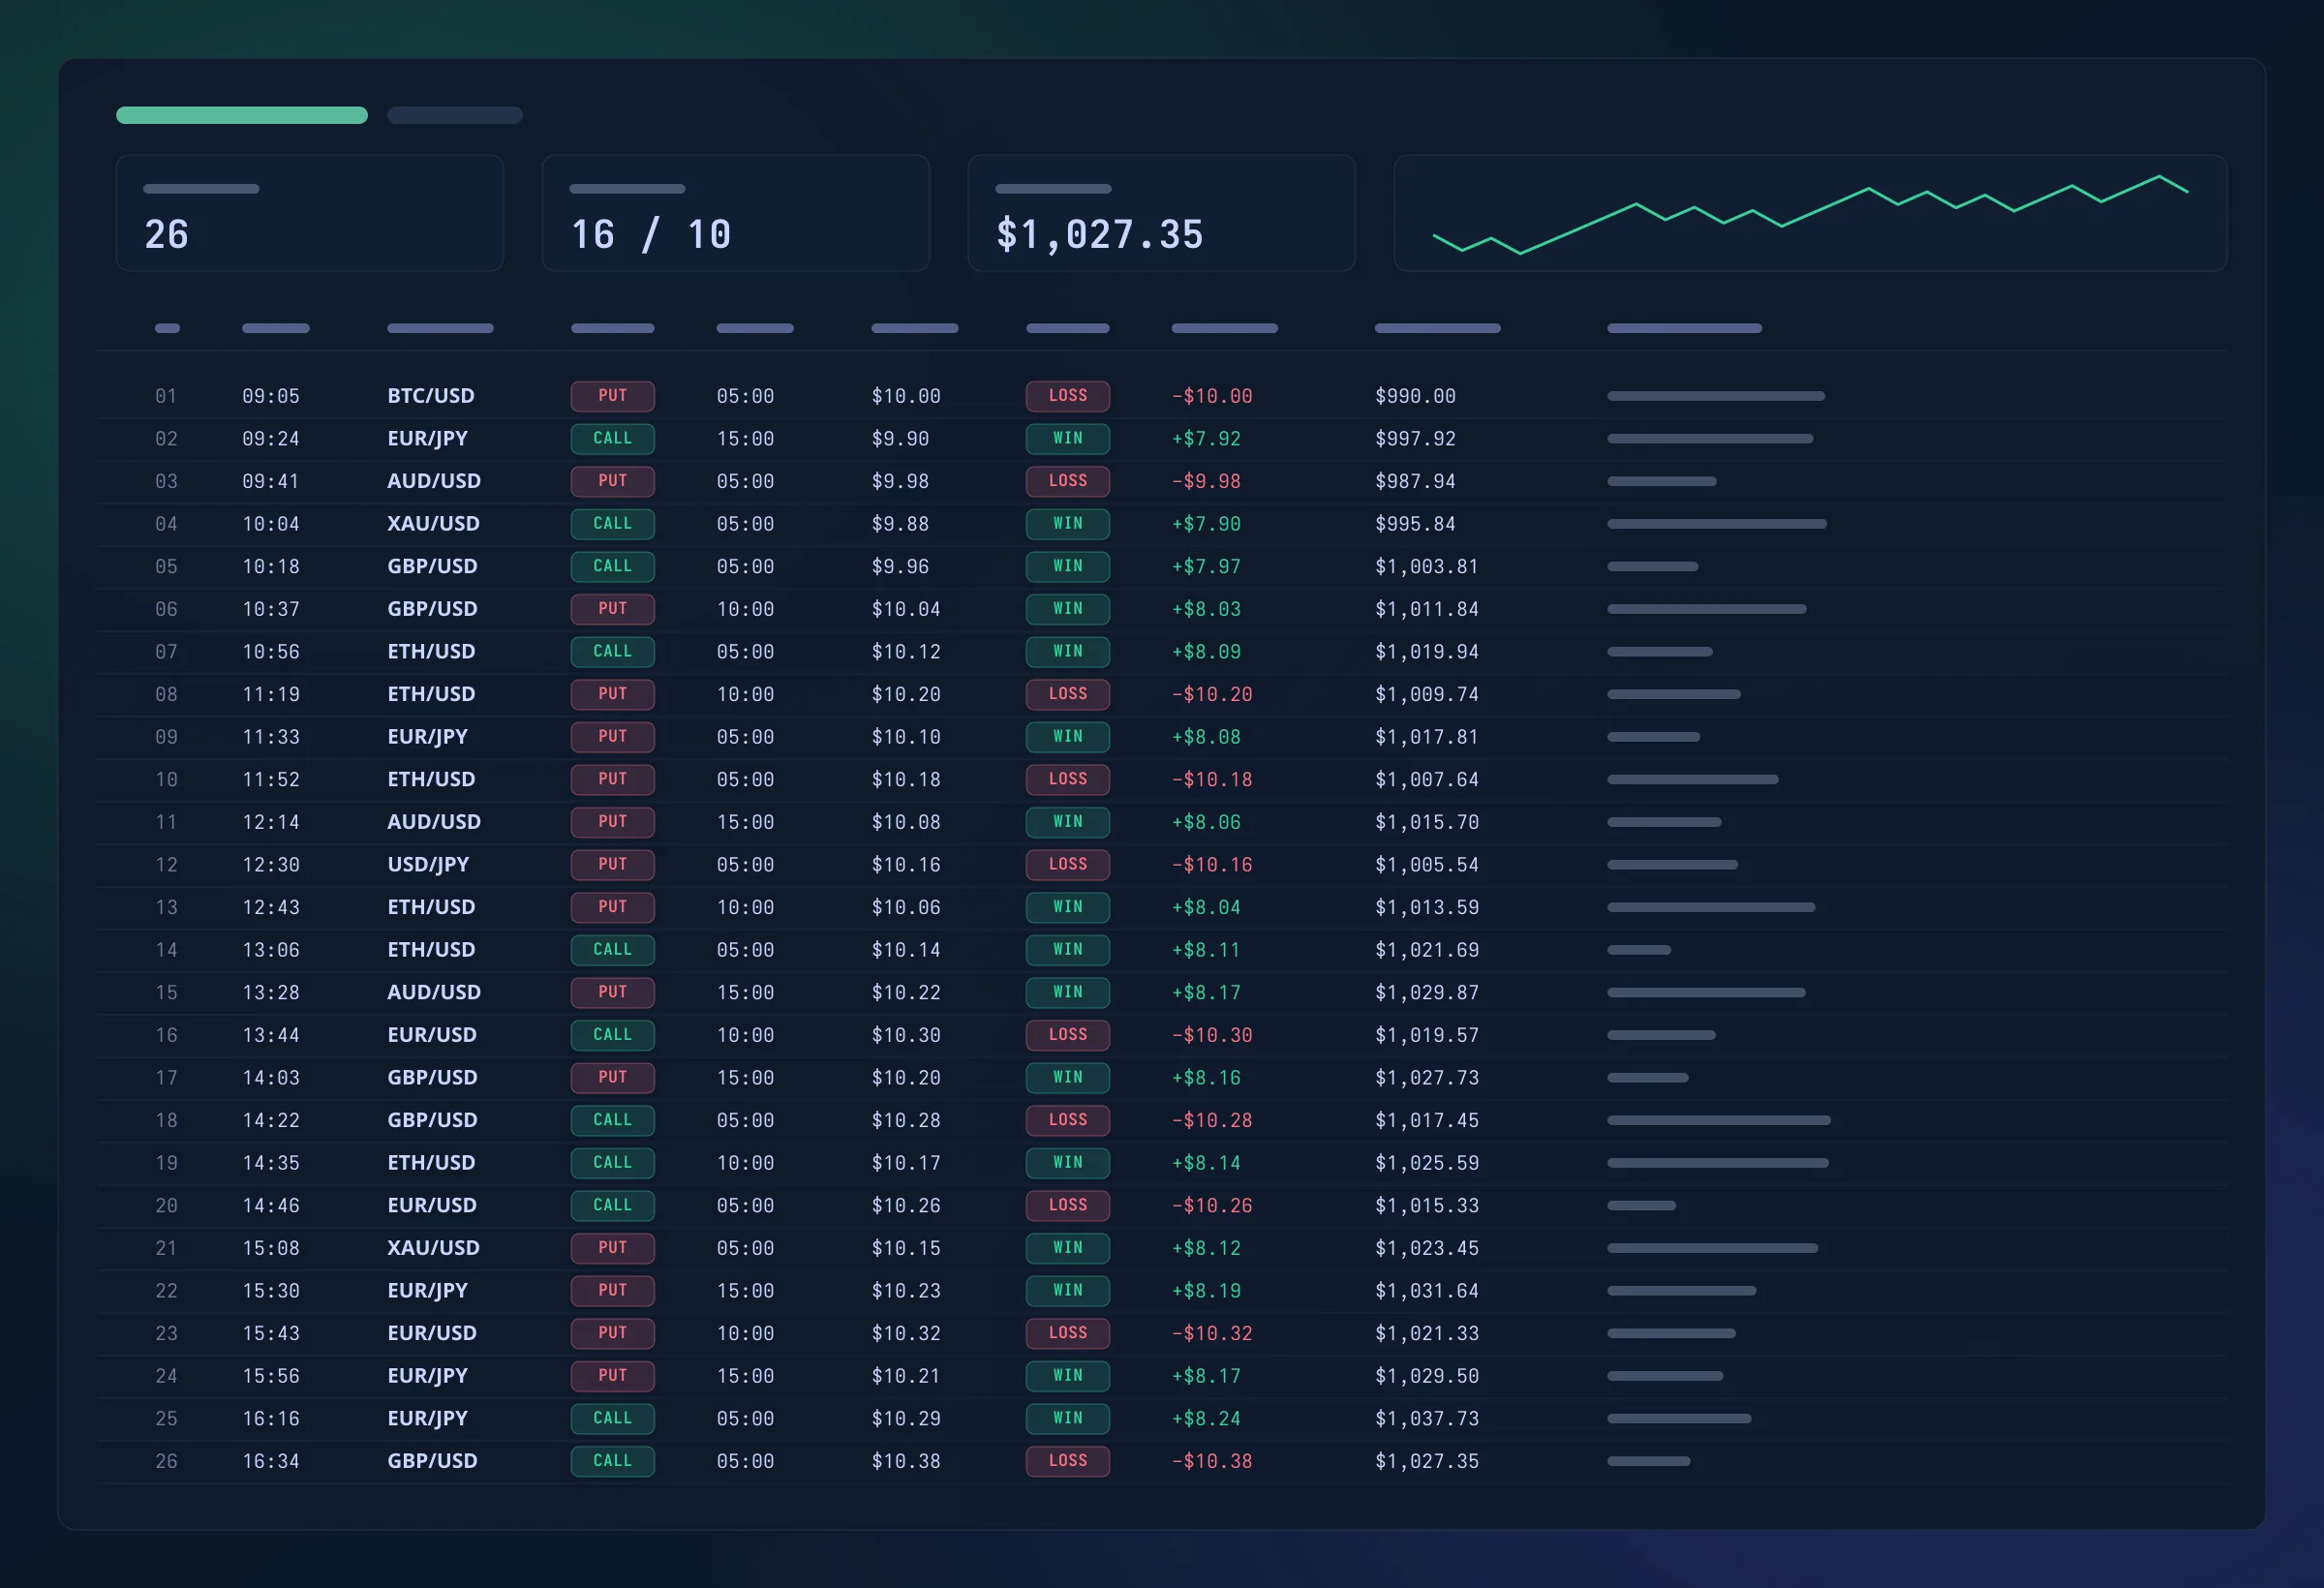
What each field of the journal is for
Each field answers a question you will ask later. The guides in the last column explain how to read that part of a signal.
Field | In the journal | What to record | Read more |
|---|---|---|---|
Asset and time |  | The asset as the signal names it, and the time you opened the trade, always in the same time zone. | |
Direction |  | CALL or PUT, copied from the signal. Never changed on a hunch. | |
Expiry |  | The expiry you actually chose. If it differs from the signal’s, write down why. | |
Stake and result |  | The stake in money, the outcome and the profit or loss. The balance follows from them. | |
Note |  | One sentence on why you took the trade and how you felt. It is the field that explains a losing streak. | |
Weekly summary |  | Trades, win rate, average payout, result and deepest fall. Compare like with like. |
Questions traders ask about money management
What stake should I start with?
For most traders, 1% to 2% of the balance per trade, until the journal holds at least 200 trades on the same kind of signal. Then check three things:
your measured win rate against the break-even rate for your usual payout;
your deepest fall so far, and whether you could live with twice that;
whether you actually kept the stake unchanged, which the journal shows.
Should I raise the stake after a winning run?
No more than a fixed percentage already does. A 1% stake grows with the balance on its own. Raising the percentage after wins tends to put the largest stakes just before the next losing run, because nothing about a winning run makes the next trade more likely to win.
Should I stop for the day after a big win?
You can, but not because the next trade has become riskier; the arithmetic of each trade is the same as before the win. Some traders set a daily profit target and stop there, because a good day tends to make them careless. That does not improve the expected result, but if it keeps the stake and the rules unchanged, it does its job.
Is martingale safer with a smaller first stake?
It moves the problem further away without removing it:
From $1 on a $1,000 balance, nine losses cost $511 and the tenth stake, $512, no longer fits.
At an 80% payout, any cycle with three or more losses before the win ends down, as the martingale section shows.
At a 60% win rate, a run of ten or more losses turns up in about one sample of 200 trades in eighty.
What is a reasonable daily loss limit?
One you would accept losing on a bad day without wanting it back. We use four stakes, which is 4% of the starting balance at a 1% stake. Some traders prefer a limit in money, such as $40 on $1,000; the effect is the same while the balance stays close to where it started.
Does a high-confidence signal justify a bigger stake?
No. Confidence ranks signals against each other; it is not the probability that one particular trade wins. Keep the stake fixed. If you want to act on confidence, set your own threshold and skip the signals below it instead of betting more on those above it.
How many trades do I need before I can trust my win rate?
More than most people expect. For a trader whose true win rate is 60%, the rate measured in the journal usually lands in these ranges:
after 100 trades, between about 50% and 70%;
after 200 trades, between about 53% and 67%;
after 400 trades, between about 55% and 65%.
That is why a measured 56% after 100 trades cannot tell you whether you are above the 55.6% break-even.
What should I do after hitting the daily limit?
Close the platform and write one line in the journal about the session. Then:
Start tomorrow from the new balance, which makes the stake a little smaller.
If the limit is hit three sessions in a row, pause and review the last 30 trades before trading again.
Where can I check whether binary options are legal where I live?
With your national financial regulator. Three starting points:
In the EU, ESMA's decision to prohibit binary options for retail clients, since replaced by national measures.
In the UK, the FCA's permanent ban on selling binary options to retail consumers, in force since 2 April 2019.
In the US, the joint CFTC and SEC investor alert on which platforms may offer them legally.
Further reading
The guides this one builds on, in the order we suggest reading them.
- Beginner
How to read an AI signal
The fields of a signal, from the asset to the expiry, on one worked example.
2 min read - Beginner
Trading journal: what to record
A journal entry that is easy to come back to when you review your decisions.
1 min read - Intermediate
Statistics for a selected period
How the date range and the number of records change what a win rate means.
1 min read